- calendar_month November 17, 2022
- folder Absorption Rate
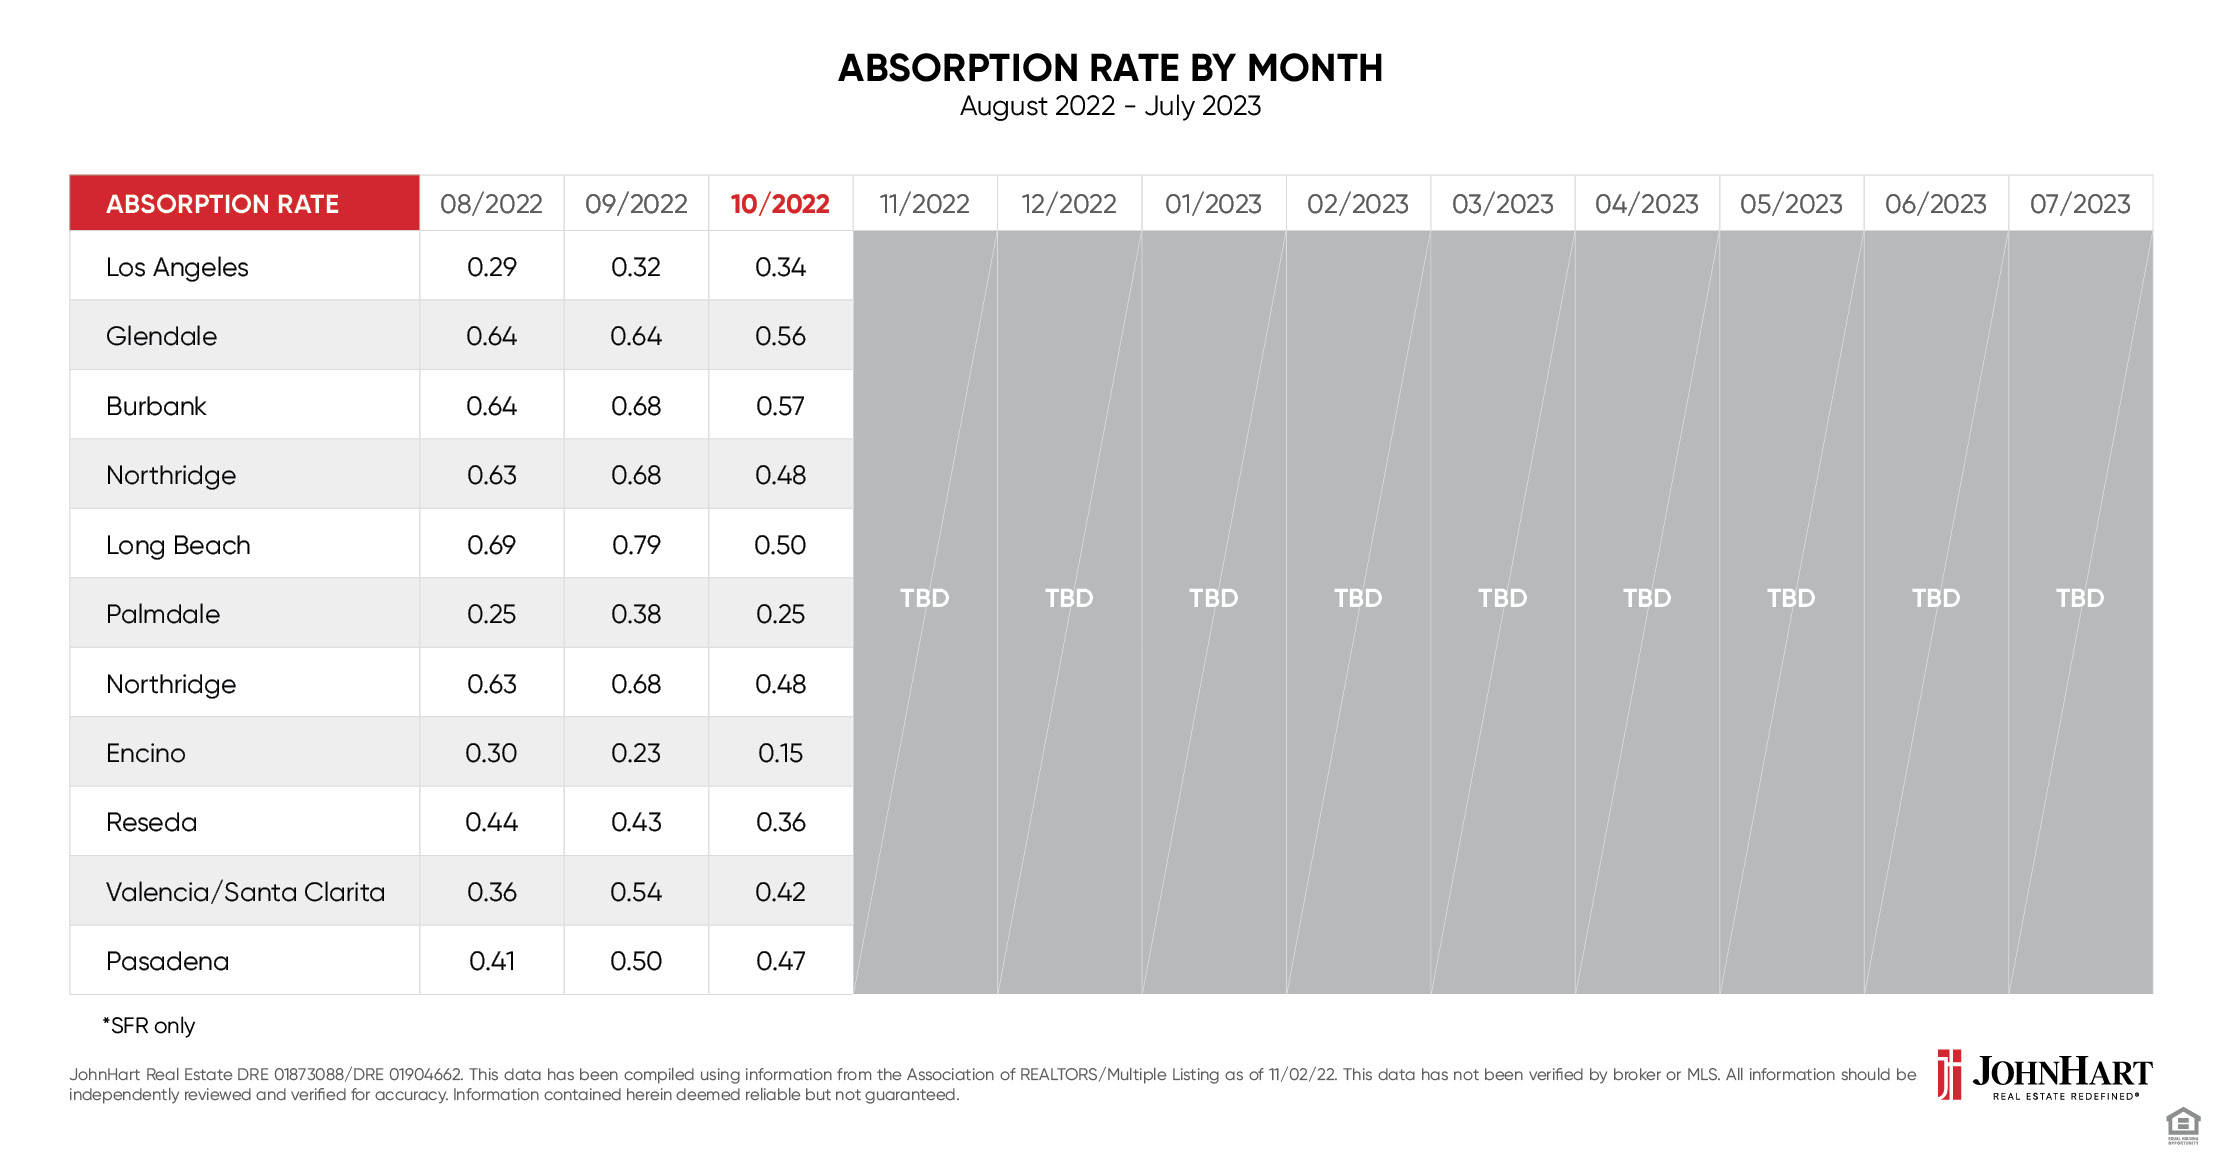
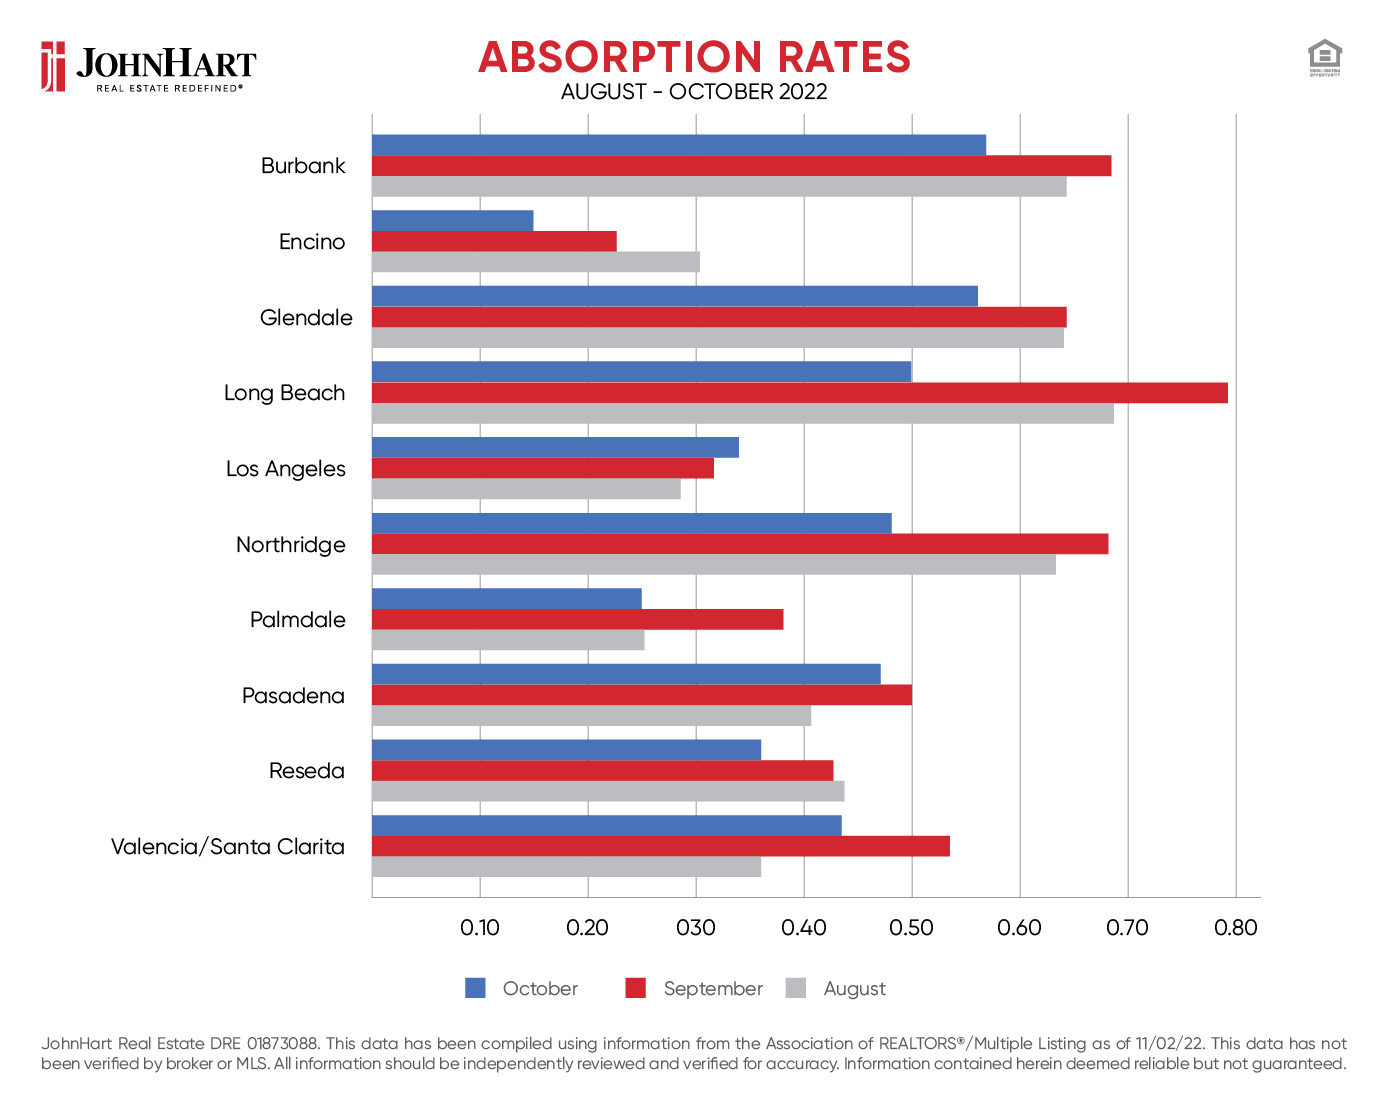
You only need to glance at our Absorption Rate Analysis chart for October to see it was a month that brought big changes. For as long as we’ve been officially tracking absorption rates, we’ve seen almost unanimous movement toward a seller’s market. But for the first time, we actually saw all areas except one drop toward a buyer’s market! And while most are still firmly in seller’s market territory, one area has actually breached the universal threshold for a buyer’s market! Let’s take a closer look at what October’s trends might mean for the houses for sale in LA.
Absorption Rates – October 2022
- Long Beach – 50%
- Burbank – 57%
- Northridge – 48%
- Glendale – 56%
- Valencia/Santa Clarita – 42%
- Pasadena – 47%
- Reseda – 36%
- Palmdale – 25%
- Los Angeles – 34%
- Encino – 15%
How We Determine Our Absorption Rates

Photo credit: PinkAechFas
Just a couple of quick reminders before we get to the good stuff.
- Our absorption rate analysis only accounts for houses for sale in LA and the surrounding areas we service. We don’t factor in condos and townhouses because single family homes are more representative of our clients’ interests.
- Universally, it is accepted that 20% and above indicates a healthy seller’s market. Meanwhile, 15% and below signifies a healthy buyer’s market. But Los Angeles is unique when compared to the national market, so don’t take these numbers as gospel.
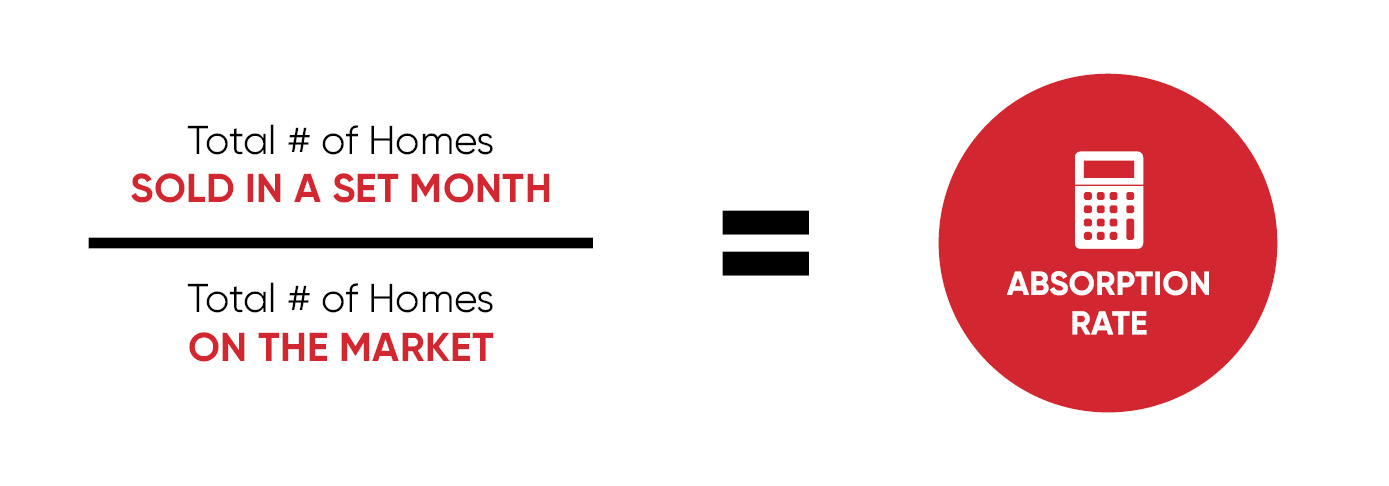
- To calculate absorption rate, we simply divide the total number of homes sold in a month by the total number of homes in the market for a given area. See the formula below:
A Trend Breaking Month for Houses for Sale in LA
October is the first month to break the upward trajectory we’ve witnessed the past few months. If you’ve been following with us, you’re used to seeing houses for sale in LA move deeper into a seller’s market. Yet, in October, almost every area slid backwards toward a buyer’s market.
For those that haven’t gotten comfortable with these terms yet, a buyer’s market often indicates a larger inventory of homes on the market. It’s a pretty striking reality given the media coverage of the allegedly drying up inventory of houses for sale in LA. October’s absorption rate statistics show us that’s not necessarily the case.
Encino May Have Entered a Buyer’s Market

Photo credit: JGKlein
Since starting our monthly Absorption Rate Analysis column, we hadn’t seen an area dip below a 23% absorption rate. That changed in October as Encino plummeted to a 15% absorption rate. In one way, this isn’t too surprising. After all, Encino has consistently boasted the lowest absorption rate of all of the areas we track.
But Encino was just at 30% in August, so this is a pretty radical drop. And it puts the valley neighborhood right at the threshold of a buyer’s market. That’s worth noting. Encino is 10% lower than any of the other areas we service, but all neighborhoods except for one dropped to a lower absorption rate in October. And we’ll get to that outlying neighborhood in a moment.
October’s Dramatic Drops
The area with the most dramatic absorption rate drop in October was easily Long Beach. The city plummeted a stunning 29% from its previous month’s 79% absorption rate. In September, Long Beach held the highest absorption rate of all of the areas we service, but October found it being beaten out by Burbank. While Burbank had its own significant drop, it held on enough to claim the highest absorption rate in October at 57%.

Photo credit: Darkest tree
That’s news in itself: October’s highest absorption rate is 22% lower than September’s highest absorption rate! Neighboring Glendale was just behind Burbank, nipping at its heels with a 56% absorption rate.
The Single Area That Moved Deeper Into a Seller’s Market
Only one area surged to a higher absorption rate in October… and we’re being generous by calling it a surge. The city of Los Angeles hopped from an absorption rate of 32% to 34% in October. While this isn’t an impressive leap, it’s notable for being the singular upward trend in a month where every other market moved closer to a buyer’s favor. Los Angeles steadfastly continues to build toward the seller’s market.
Numbers Still Show a Favorable Time for Houses for Sale in LA
.jpg)
Photo credit: Ken Lund
As every area (except for Los Angeles proper) have edged toward a buyer’s market with Encino possibly entering a buyer’s market, it’s the perfect time to review what that means. We recently covered a buyer’s market versus a seller’s market in-depth. But as a general overview, Encino appears to have a larger inventory of homes remaining on the market longer.
This hands an advantage to the buyer because they seemingly have less competition. Meanwhile, in Los Angeles, homes appear to be spending less time on the market than they were in September. Therefore, those conditions favor the seller who can take advantage of buyer competition.
While most houses for sale in LA and its surrounding neighborhoods spent October moving toward a buyer’s market, all neighborhoods but Encino are still strongly in a seller’s market. At least where the numbers are concerned, anyway. And as our CEO Harout Keuroglian pointed out in our very first Absorption Rate Analysis column, LA’s unique market leaves those numbers more open to interpretation. In short, this market continues to be what you make of it.